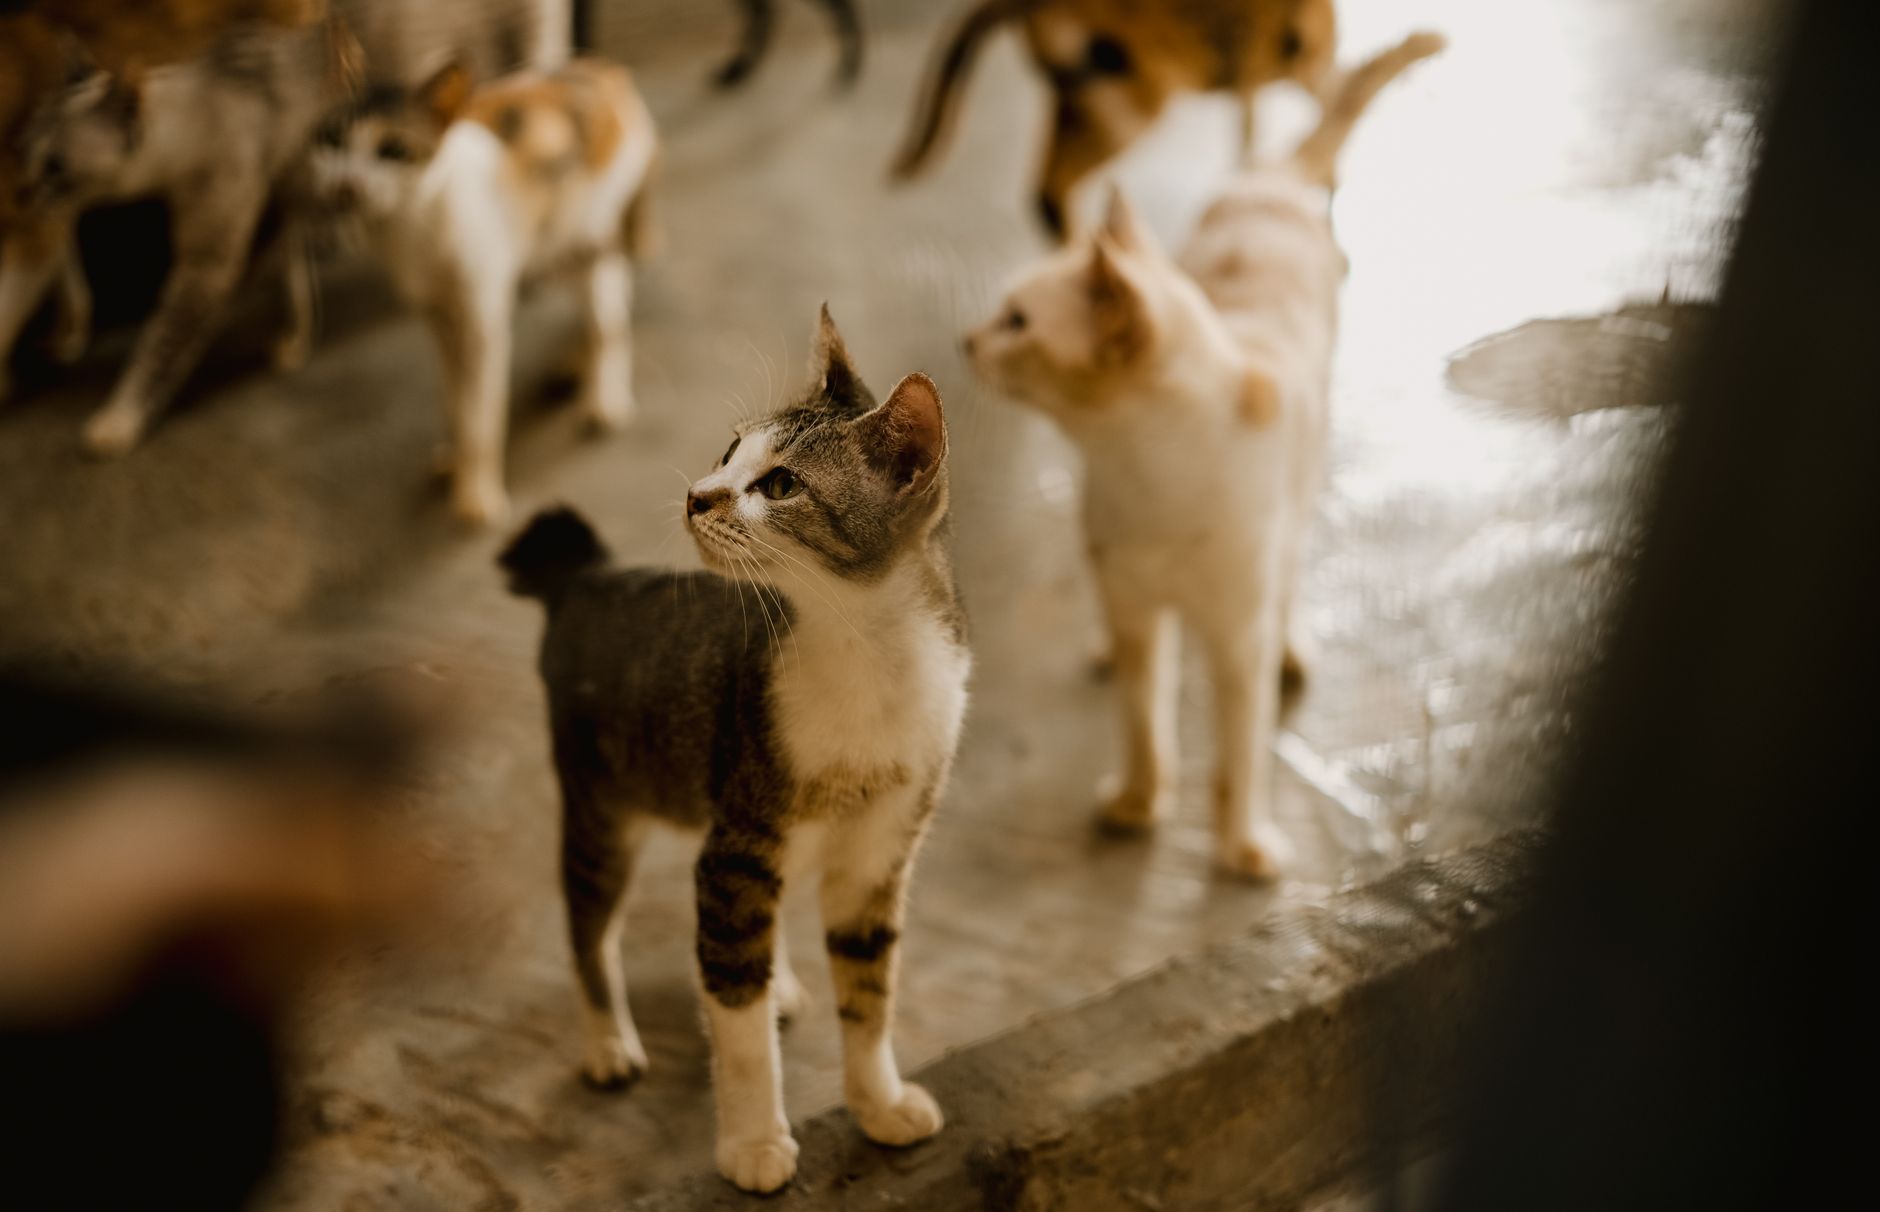
Cat adoption fees have increased 11% in 2026 and now range from $50 to $155 at most shelters, reflecting rising operational costs across the industry. While demand for adoptable cats remains relatively stable—with approximately 2.2 million cats adopted in 2025 and a 63% adoption rate—the real story lies in how regional differences and the rising cost of pet ownership are reshaping who adopts and where. A family adopting a kitten in New York City might pay $150 at a private rescue, while the same adoption in a municipal shelter in rural Vermont could cost $50, yet the first-year expenses for that kitten—veterinary care, supplies, food, and preventive medicine—typically run $1,000 to $2,500, regardless of initial location.
The 2026 adoption market reflects a stable but regionally fragmented landscape. While overall adoption numbers remain healthy and household cat ownership has climbed to 39% of U.S. homes (approximately 53 million households), an 8.2% increase from the previous year, the distribution of these adoptions, the escalating financial barriers to care, and the divergent experiences across geographic regions tell a more complex story than headline numbers suggest. Pet parents are increasingly reporting that high costs impact their ability to provide the level of care they’d prefer—55% cite this as a barrier—making the affordability landscape critical to understanding where adoptions actually happen.
Table of Contents
- How Have Adoption Fees Climbed in 2026?
- Is There Actually Strong Demand for Cat Adoption?
- Which Regions Are Leading or Lagging in Cat Adoptions?
- What Are the True First-Year Costs of Cat Adoption?
- How Are Rising Costs Affecting Pet Parent Behavior?
- Who Is Driving the Growth in Cat Adoptions?
- How Is the Distribution of Adoptions Across Shelter Types Shifting?
How Have Adoption Fees Climbed in 2026?
adoption fees vary dramatically by shelter type and have risen across the board. Municipal shelters typically charge $0 to $150, while private rescues range from $75 to $255, and breed-specific or specialty rescues for purebred cats can exceed $500 to $3,500. The 11% year-over-year increase in 2026 reflects higher operational costs: utilities, veterinary care, staff wages, and facility maintenance have all accelerated, with health-related expenses specifically rising 15% on average. A municipal shelter in Cleveland might raise its adoption fee from $60 in 2025 to $67 in 2026, while a private rescue in Seattle handling complex behavioral rehabilitations might increase from $200 to $222, both justified by genuine cost pressures rather than market speculation.
This fee landscape creates a tiered adoption system. Lower-income households gravitate toward municipal and government shelters where fees are minimal or absent; middle-income adopters often use private rescues and open-admission shelters; wealthier adopters can access breed-specific cats through specialty rescues or breeders. None of these tiers has it easy: even at a $0 fee, the adopter faces $200 to $400 in immediate supplies (litter box, carrier, food, toys) plus the first veterinary visit. The 11% increase in fees has compressed margins for families on tight budgets and has not, by most accounts, reduced shelter intake—3 million cats entered U.S. shelters and rescues in 2025—suggesting that fees are not the primary driver of adoption decisions but are still felt as a real cost barrier.
Is There Actually Strong Demand for Cat Adoption?
The language of “demand” can mislead here. Adoptions are steady rather than surging, and in the first half of 2025, overall shelter adoptions actually slowed. Cats are faring better than dogs proportionally—with a 63-64% adoption rate—but this reflects the volume of cats in shelters, not necessarily explosive demand. The more accurate framing is one of stable adoption sustained by specific demographic shifts: Millennials and Generation Z are driving cat ownership growth at rates that outpace older generations.
For a 28-year-old professional working from home, the cat adoption rate in their urban neighborhood might be high; for a family with limited disposable income and no remote work flexibility, demand for adoption may be tempered by the reality of first-year costs reaching $2,500. What’s actually straining the system is not lack of demand but mismatch: shelters report being over-capacity with animals and lacking sufficient resources and outcomes, suggesting oversupply in many regions rather than shortage. In new England, adoption rates exceed 70%, meaning shelters move animals quickly; in southern states, resource shortages and overcrowding indicate that demand does not keep pace with intake. This geographic tension is critical: a cat in Burlington, Vermont has a very high probability of adoption or long-term fostering; a cat in a rural Arkansas shelter faces longer stays and more uncertain outcomes.
Which Regions Are Leading or Lagging in Cat Adoptions?
Cat adoption performance is sharply divided by region, with New England consistently outperforming the rest of the country. Adoption rates in New England exceed 70%, reflecting higher per-capita incomes, more established rescue networks, and a cultural emphasis on animal welfare. Vermont leads the nation with a cat ownership rate of 44.6%, followed by Montana, Washington, Idaho, Wyoming, Utah, and New Mexico—predominantly northwest and mountain states where smaller populations mean tighter-knit animal rescue communities and often lower operational costs (and thus lower adoption fees).
In contrast, southern and rural states struggle with overcrowding, underfunded shelters, and adoption rates well below the national average. A shelter in rural Mississippi may struggle to move adult cats due to lower local demand, fewer rescue partnerships, and minimal marketing resources, while a rescue in Portland, oregon operates a waitlist for adoptions. Regional price differences also reflect this inequality: adoption fees in high-cost-of-living areas like New York and California are 50% to 100% higher than in rural Midwest or South, driven by higher labor, rent, and veterinary costs. A family moving from Kansas to San Francisco discovers that the same cat available for $40 at their old rural shelter now costs $175 at a Bay Area rescue.
What Are the True First-Year Costs of Cat Adoption?
Beyond the adoption fee, first-year expenses for a newly adopted cat typically range from $1,000 to $2,500, a 5% increase from the prior year. Upfront costs break down roughly as: initial veterinary exam and vaccines ($200–$400), spay/neuter if not already done ($300–$500), microchipping ($25–$50), initial food and supplies ($150–$300), litter and box ($50–$100), toys and enrichment ($50–$150), and unforeseen medical issues ($200–$600). An adopter budgeting conservatively might spend $1,000; one facing unexpected dental work, urinary tract issues, or behavioral problems could exceed $2,500. Many new cat parents are surprised to learn that the $75 adoption fee was the smallest expense they’d incur in that cat’s first year.
After the first year, annual ongoing costs typically settle between $700 and $1,500, covering routine veterinary care, preventive medications, food, litter, and minor supplies. However, this baseline assumes a healthy adult cat; any chronic condition (diabetes, hyperthyroidism, kidney disease) or behavioral need (anxiety, litter box issues requiring environmental changes) can easily double ongoing costs. For the 55% of pet parents who report that rising costs have impacted their ability to provide preferred levels of care—whether that means fewer vet visits, cheaper food, or delayed dental work—the gap between ideal and achievable care is widening. A cat owner in Los Angeles spending $1,200 annually on routine care may face $1,800 to $2,000 if the cat develops a chronic condition, a scenario many households cannot accommodate.
How Are Rising Costs Affecting Pet Parent Behavior?
The 15% increase in health-related expenses year-over-year is straining households across income levels. Preventive care—annual exams, vaccines, bloodwork for senior cats—remains expensive in urban and suburban areas, ranging from $300 to $600 annually at established veterinary clinics. Low-cost clinics help moderate-income families but often operate on limited schedules and may not provide comprehensive diagnostics or follow-up care. One concerning pattern is postponement: some pet parents delay vaccinations, defer dental care, or avoid diagnostic bloodwork for aging cats due to cost, a calculus that may save $300 immediately but risks far larger expenses later if illness goes undetected.
The income elasticity of cat adoption is real but underreported. While 39% of U.S. households own cats, the breakdown by income bracket likely favors higher earners who can absorb adoption fees and fluctuating veterinary costs without hardship. A single parent earning $30,000 annually can still afford to adopt a cat—municipal shelters make this possible—but the risk of an unexpected $1,000 emergency veterinary bill is genuinely threatening. Payment plans, credit options, and pet insurance are expanding, but adoption of these services among lower-income adopters remains limited, partly due to distrust and partly due to the friction of enrolling in additional financial products.
Who Is Driving the Growth in Cat Adoptions?
Millennials and Generation Z are the primary engines of cat adoption growth, outpacing older generations in adoption rates. These younger adopters tend to live in urban and suburban areas, work in professional or knowledge jobs (with many now remote), and are more engaged with social media and online rescue communities. A 30-year-old professional in Chicago scrolling Instagram may discover a cat available at a Chicago-area rescue, fill out an application, and complete the adoption within weeks—a process that would have taken much longer a generation ago. This demographic shift has indirectly benefited urban and suburban rescues and hastened the decline of rural and rural-adjacent animal shelters that have lost local adoption momentum.
The generational divide also reflects divergent attitudes toward pet spending. Younger adopters are more likely to invest in environmental enrichment, behavioral modification, and preventive veterinary care, normalizing higher lifetime costs for cat ownership. However, this cohort is also characterized by economic precarity—student debt, housing insecurity, stagnant wages—creating a paradox where younger adults adopt more cats but often with less financial cushion than older adopters. A Gen Z adopter may provide superior enrichment to a cat but lack the savings buffer to handle a $2,000 emergency, a reality reflected in the rising use of vet payment plans and pet insurance among younger pet parents.
How Is the Distribution of Adoptions Across Shelter Types Shifting?
The adoption landscape is fragmented across four major institutional types, each capturing a roughly equal share. Private shelters handle 27% of adoptions; independent rescues 26%; shelters operating under government contract 23%; and government-run shelters 24%. This near-equal distribution masks significant underlying differences: government shelters often serve as intake facilities for strays and surrenders, handling the highest volume of difficult cases; private shelters and rescues are increasingly specialized, focusing on specific demographics (senior cats, behavioral cases, breed-specific) or foster-based models that reduce overhead and adoption fees.
The trend toward rescue-network partnerships and foster-based models has accelerated, allowing smaller community-based organizations to handle adoptions without high facility costs—a model that suppresses adoption fees but requires volunteer labor and community trust. In high-adoption areas like New England and the Pacific Northwest, the distinction between shelter types has blurred through formal partnerships: a government shelter might transfer difficult-to-place cats to a local rescue, which rehabilitates them and places them to adoption, with the government shelter funding the transfer. In resource-starved regions, this partnership model breaks down due to lack of funding and volunteer capacity, leaving government shelters as the de facto adoption provider and limiting options for adopters seeking specialized or behavioral support. The data on distribution by shelter type shows stability, but the consolidation of adoption capacity into specialized rescues with lower fees but longer timelines reflects a quiet market restructuring toward sustainability over growth.